
WYCKS.PRO Guide
How to use the platform and read the WYCKSCORE chart, on a scale from -2 to 10.
Pages & Features
Pro Tracker
The main token table covering all monitored categories on Base (Clanker & Bankr, Other Base, Virtuals, New Tokens).
- •Sortable columns: Market Cap, Liquidity, Vol 24h, WYCKSCORE, Change 24h, Snapshot Change.
- •Search by symbol or contract address (CA).
- •Filter by category, hide low-liquidity tokens automatically.
- •GitHub activity columns (stars/forks, commits/repos, 30-day contributions) for projects with a public repo.
- •Watchlist: star a token to pin it to the top of the table.
- •Click any symbol to open the price/score chart.
Whale Hub
A live feed of SmartMoney alerts — notified as soon as a token's WYCKSCORE jumps or whale activity is detected.
- •Notifications grouped by day, sorted by most recent.
- •Each alert shows signal strength (Inflow / Medium / Strong / Super Strong), current vs previous score, and the Whale Accumulation Index change.
- •Auto-refreshes every 5 minutes; relative timestamps (e.g. '4m ago').
- •Share any alert directly to X with price and market cap included.
Portfolio
Connect your wallet to see your holdings and the market's strongest momentum tokens in one place.
- •Wallet Holdings table: automatically detects which tracked tokens you hold, with live value in USD.
- •Whale Activity - Strong Momentum table: tokens currently showing a whale signal and/or yellow (elevated) score, ranked by signal tier.
- •Independent refresh for each table.
- •Share top tokens by category (Virtuals / Bankr & Clanker / Other Base) directly to X.
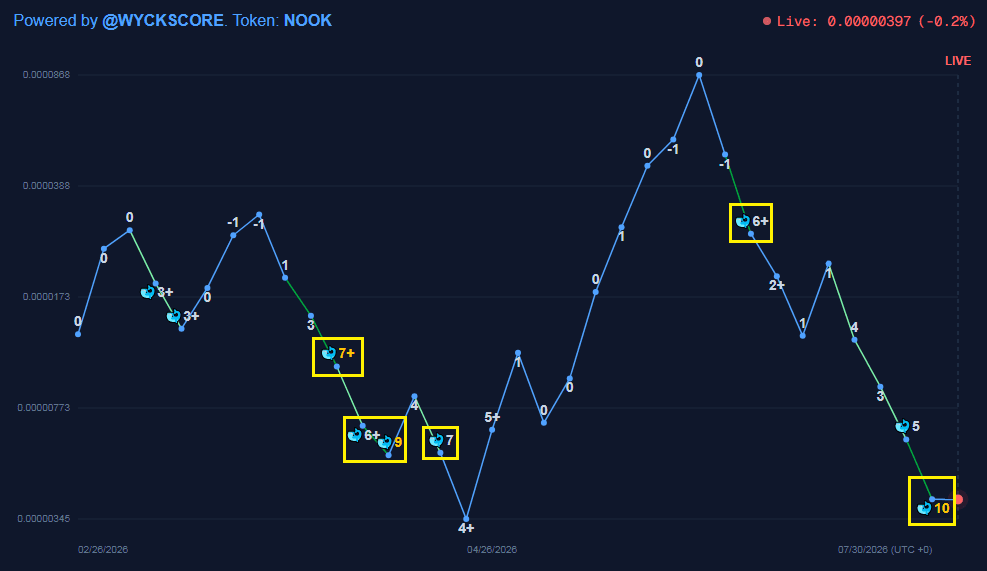
Chart Segment Colors
Dark green segment
Strong accumulation. The score is well above the recent rolling average — a significant shift in buying pressure.
Light green segment
Mild accumulation. The score is trending above the recent average.
Blue segment
Neutral / baseline zone. No notable accumulation signal for that period.
Chart Markers
Yellow score
Score is unusually high compared to normal levels — stronger-than-usual smart money activity.
Score with a + sign
Marks a point where strong capital inflow is entering the token.
🐋 Whale icon
A smart investor may have already completed accumulation. Can signal the accumulation phase is nearing its end.
Yellow-bordered box (Spring point)
A Wyckoff 'Spring' — price dips below a recent low while score rises sharply, or a repeated whale streak. Often marks the final shakeout before markup.
Whale Accumulation Index (toggle)
Optional purple overlay showing the Whale Accumulation Index at each point. A higher score indicates stronger whale accumulation. Each token is evaluated using its own relative scoring scale, making the index specific to each token.
Verify Badge (Robinhood Tracker)
Shown in the "Verify" column of the Robinhood Tracker, indicating whether a token has been verified on the Robinhood network.
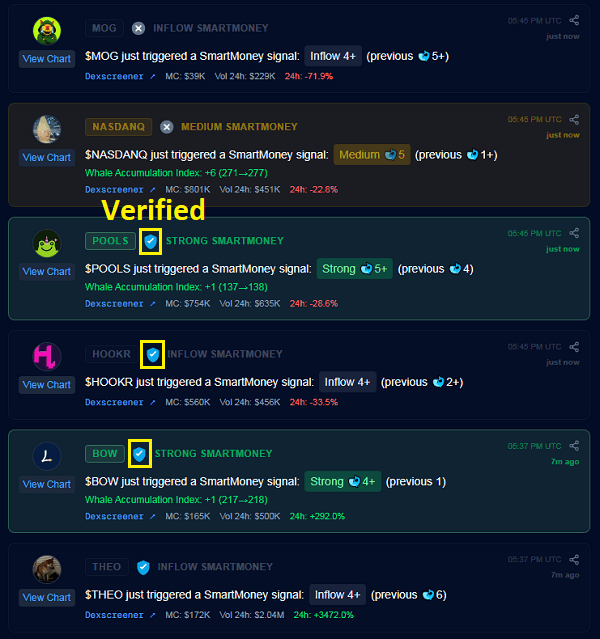
✅ Verified
Token has been officially verified on the Robinhood network.
❌ Not Verified
Token has not been verified — trade with extra caution.
SmartMoney Signal Levels
Used in Whale Hub alerts and the Portfolio strong-momentum table. Levels are ranked from an early hint to the strongest confirmed signal.
Early sign only — a sharp score jump or a '+' with a moderate score. Capital is starting to move in, but not yet confirmed by whale or high-score activity.
Either a whale accumulation point (🐋) or an elevated (yellow) score, but not both. A moderate-confidence signal.
Whale accumulation (🐋) combined with either a '+' inflow or an elevated score. A higher-confidence signal that smart money is actively building a position.
Whale accumulation (🐋), elevated score, and '+' inflow all present together. The highest-confidence signal — strong, confirmed smart money buying.
Recommendation
Combine multiple signals from the WYCKSCORE chart together, and cross-check with the underlying price chart on Dexscreener, to form the most accurate assessment before making any decision.